Household finance in Telegram messages, dashboards on my own server, and no third parties in between.
For a couple of years our household finances ran on a
Google Apps Script bot.
You'd text a Telegram bot something like food 5.5 lunch, and it appended a row to a Google Sheet.
The sheet had formulas for monthly totals, there was a pie chart command, and eventually an "AI report" from Gemini.
It worked, and logging was so cheap that we actually kept doing it, which is the hardest part of tracking money.
But the sheet had started to show its age:
- Formulas with fixed row ranges quietly stopped counting new rows. One month was €75 short, and nobody noticed.
- Categories were free text, so
Foodandfoodwere two categories. So wereClotes,ClothesandCunje. - In the group chat, every entry was saved as "undefined undefined". The script read the name from the chat instead of the sender.
- The API keys sat in plain text in the script.
- Answering anything beyond "how much this month" meant building yet another formula.
So I moved it to my own server. The rule was that nothing changes for whoever logs the entries.
What it is now
The same Telegram messages now go to a webhook on my server. A small Flask app stores them in SQLite and serves a private portal. It runs in Docker behind Traefik, next to my other sites.
Logging stays the same, with a few improvements:
- Same format:
food 5.5 lunch,in salary 2500,repeat tel 19.89 18for a monthly bill. - A typo check: if a new category is one or two letters off one you use regularly, the bot asks "Did you mean Food?" with buttons, and stores nothing until someone answers. If you confirm, it remembers that spelling.
undoremoves your last entry.summarysends last week or last month in numbers.balancegives an estimate of what's in the bank right now (more on that below).
The portal answers the questions the sheet couldn't:
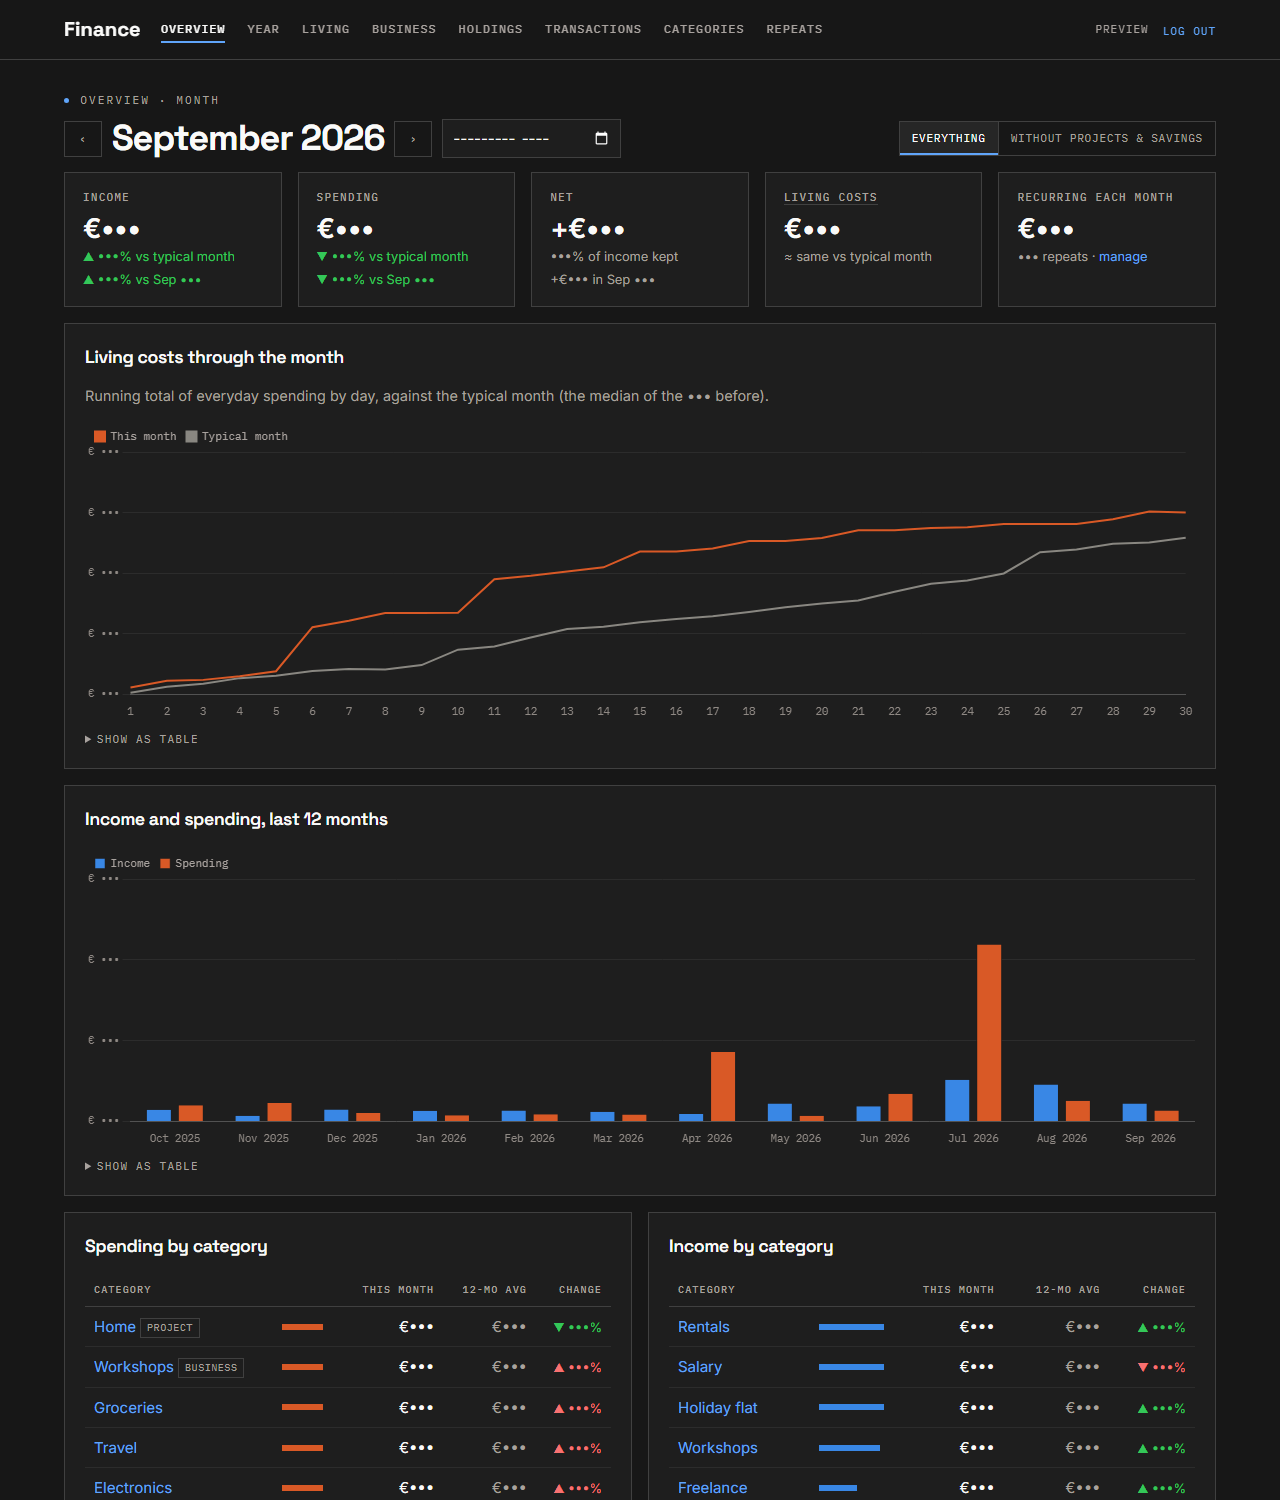
- Overview: a month compared with a typical month and with the same month last year, plus a running total of living costs that projects where the month will end.
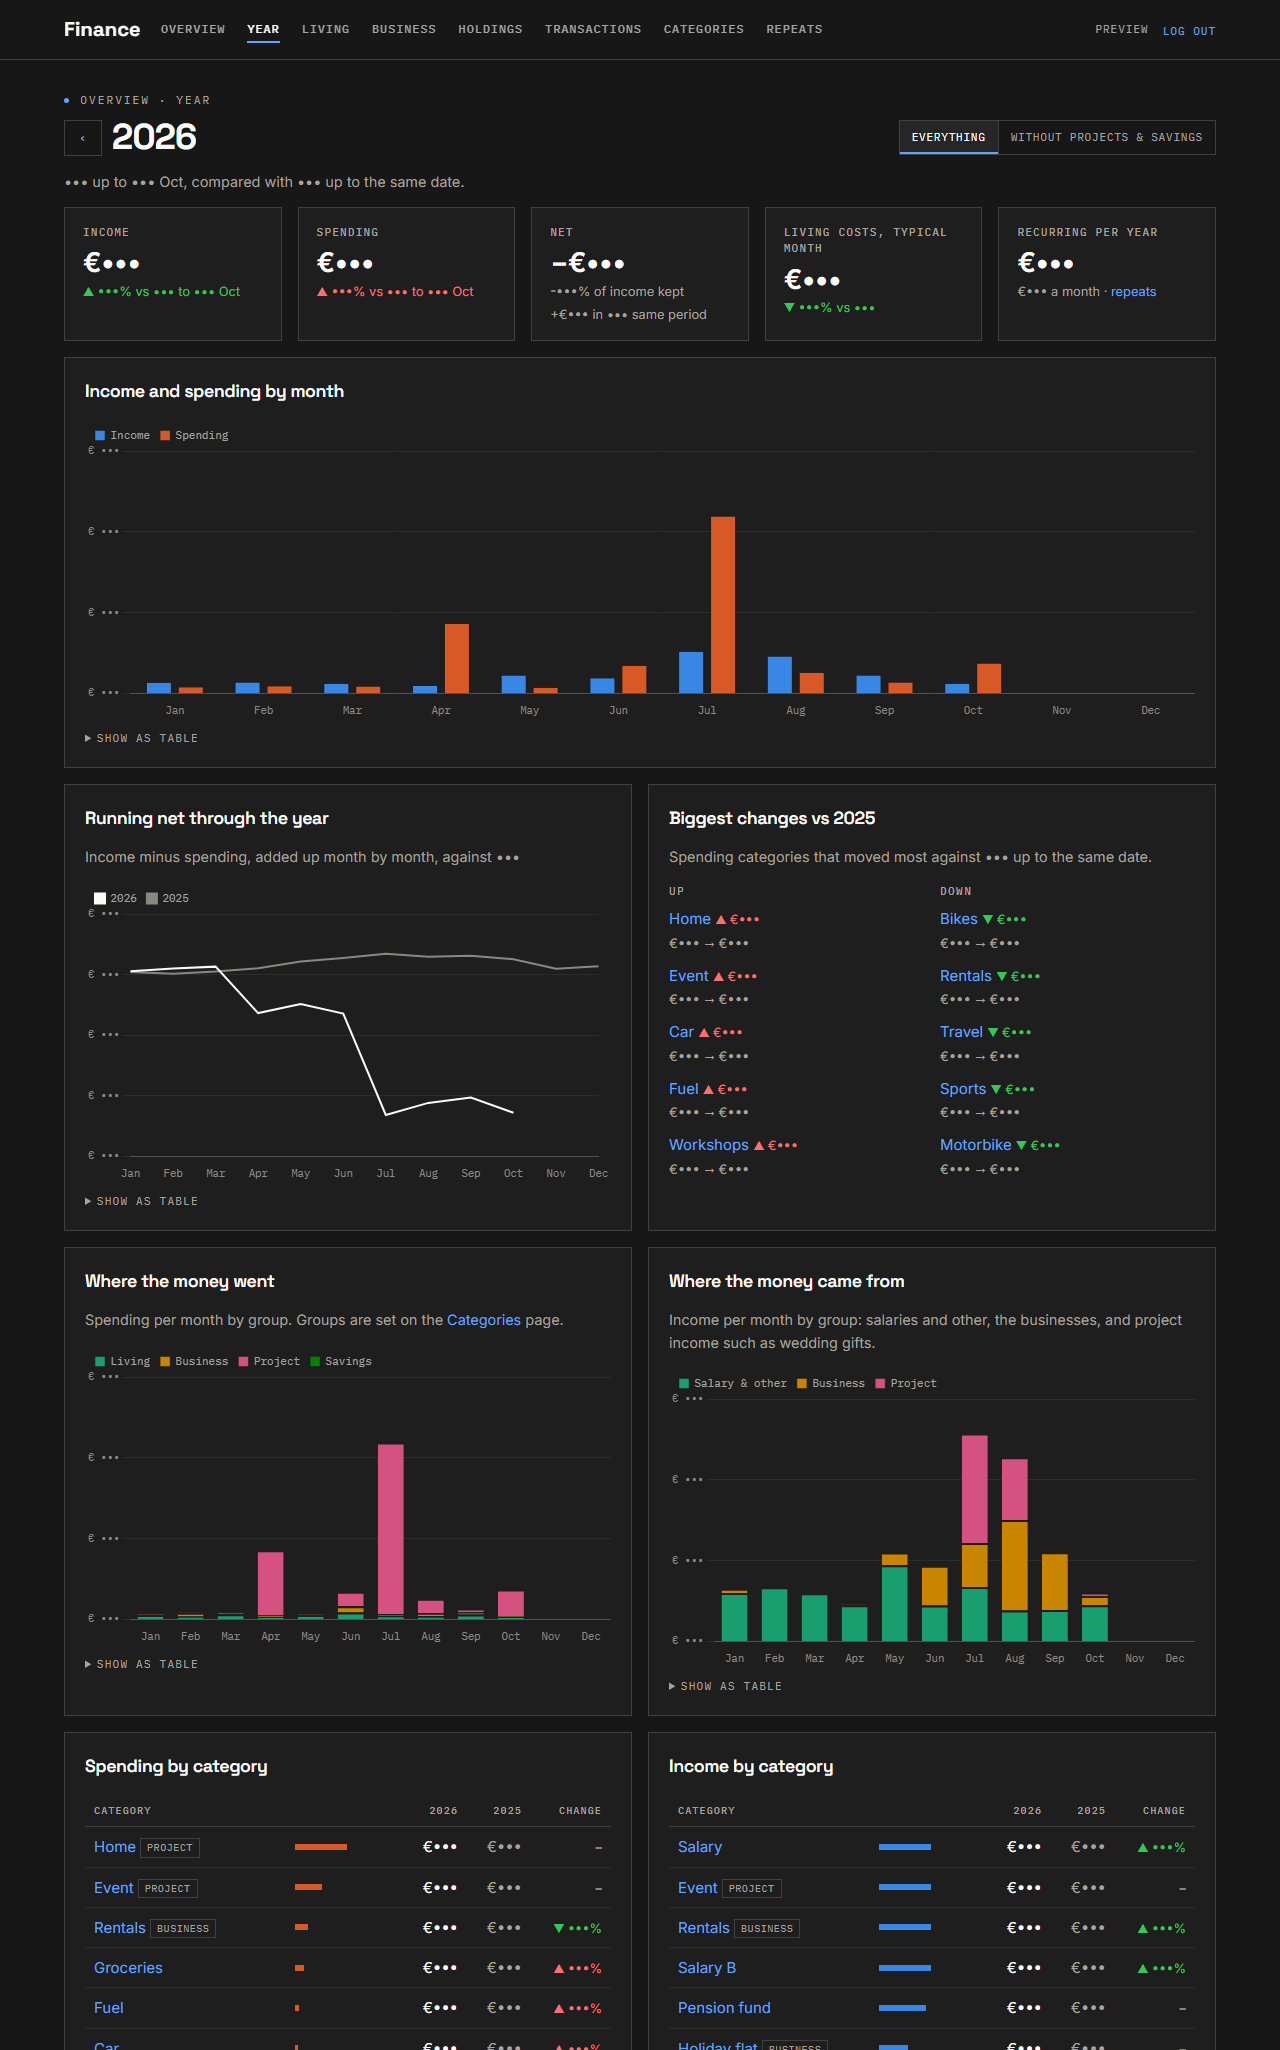
- Year: where the money went and where it came from, grouped, with the biggest changes since last year.
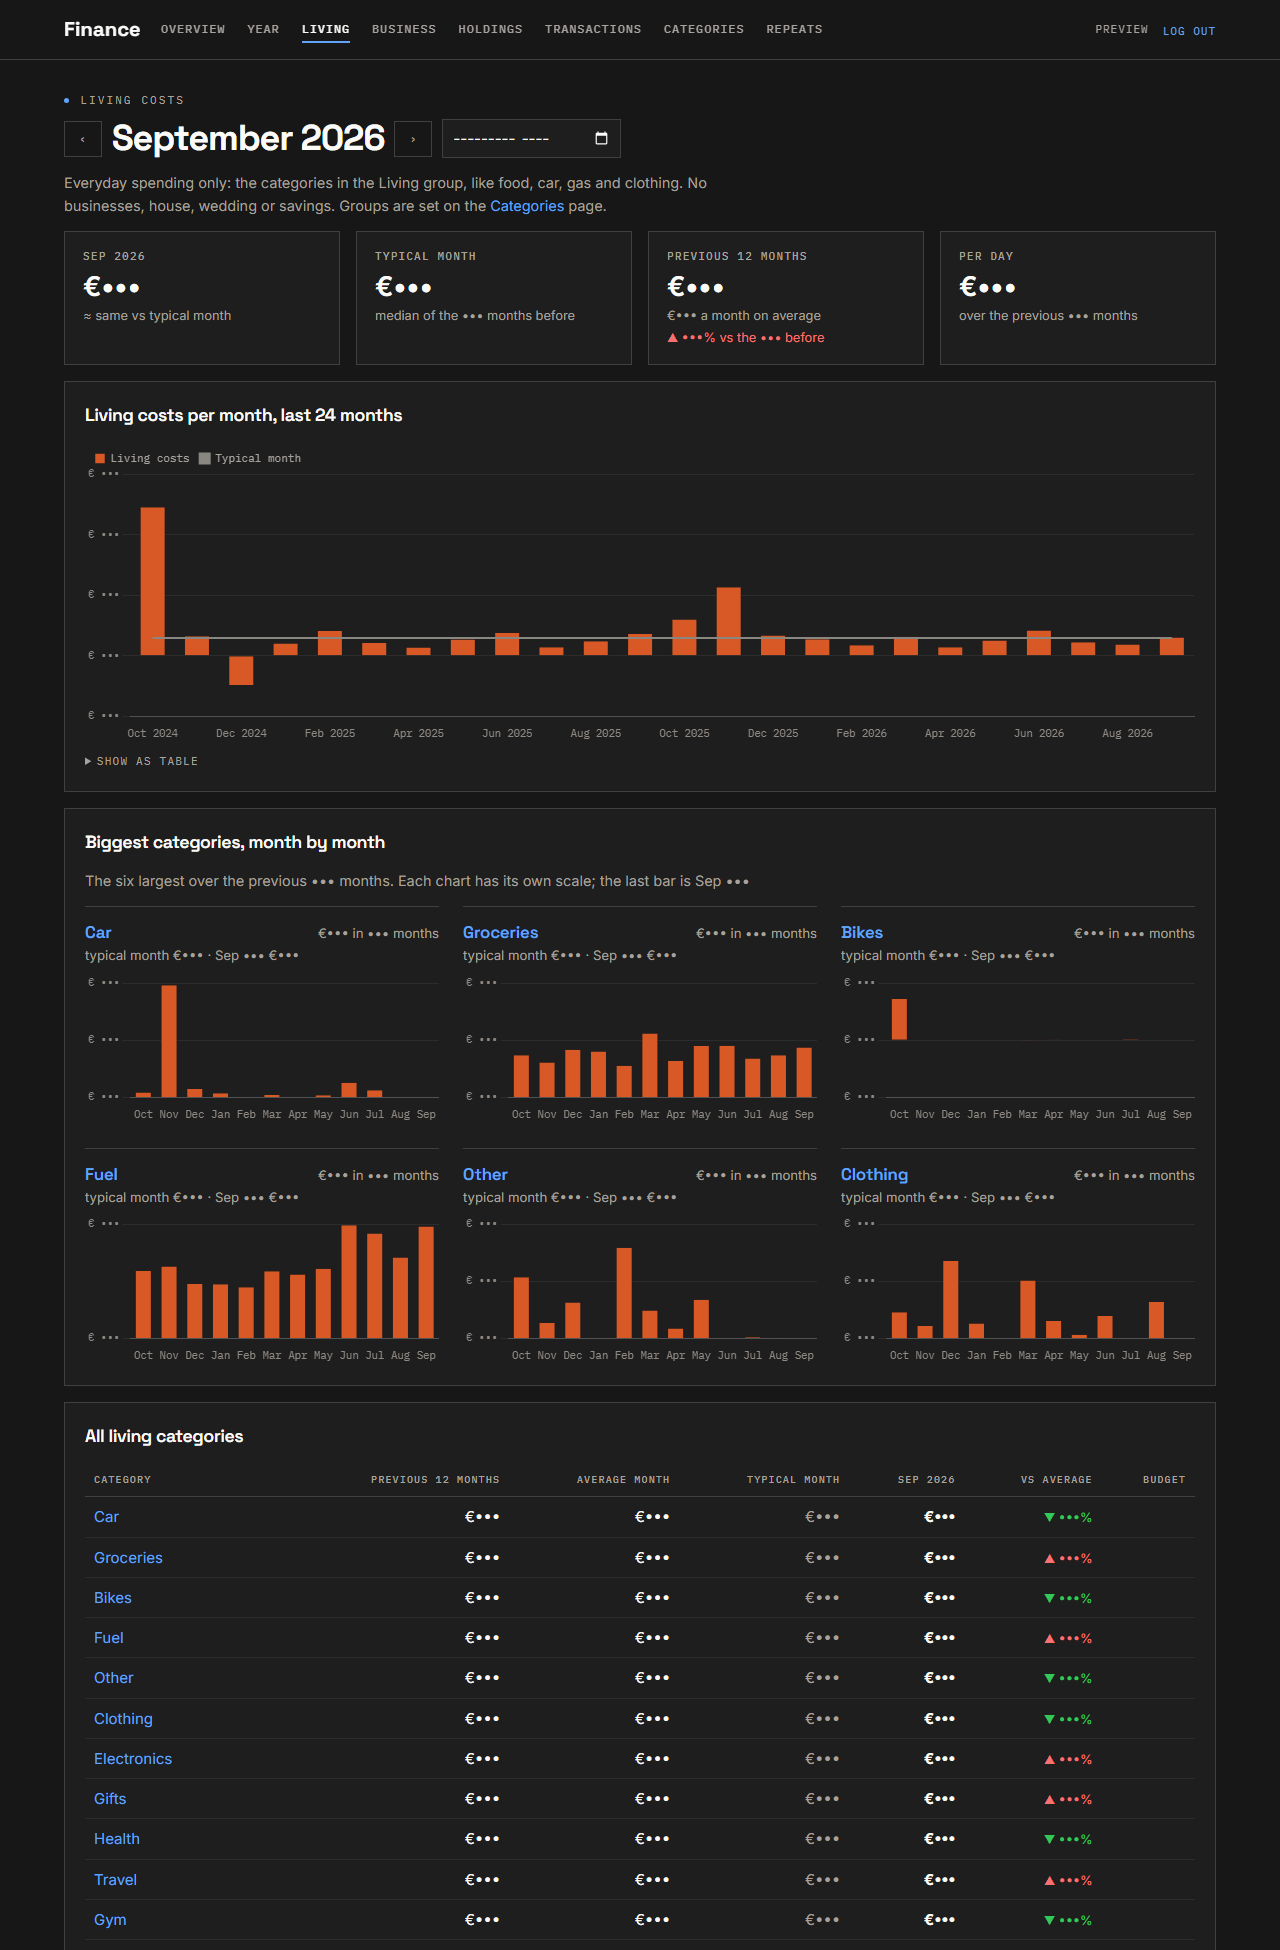
- Living: only everyday costs, with a small chart per category, so you can see what's driving a month.
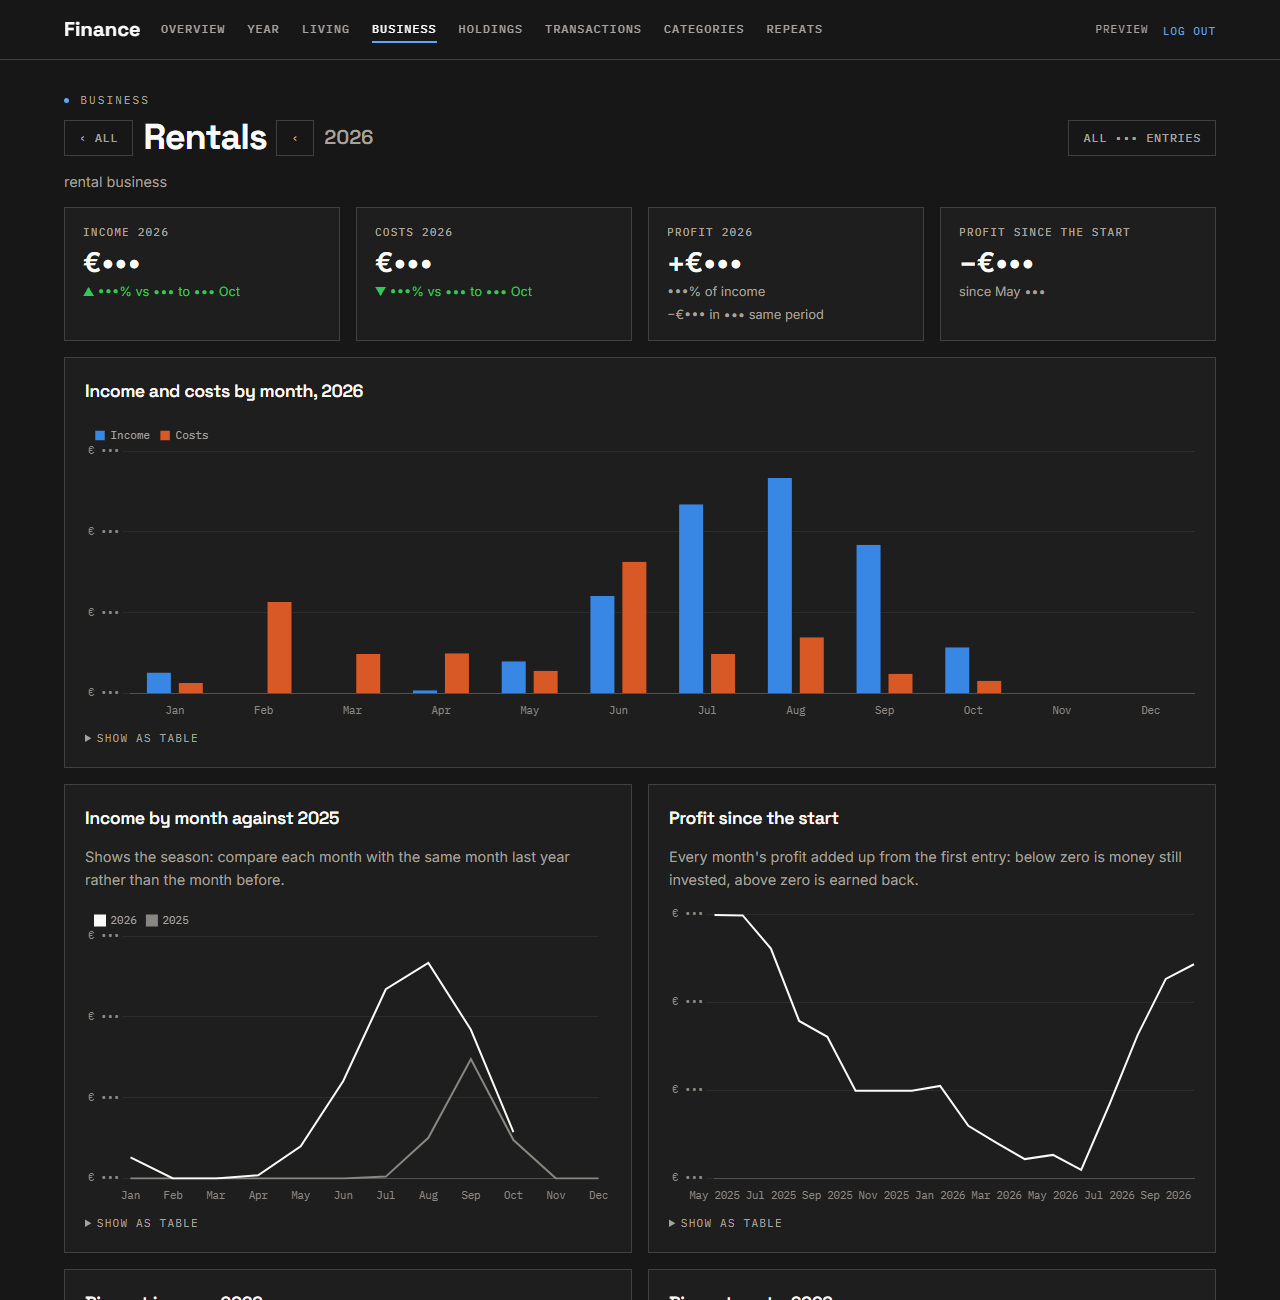
- Business: a page per side business, with profit by month, seasonality against last year, and profit since the start, which shows when an investment has been earned back.
- Holdings: the brokerage account and an estimate of bank and cash, which together give net worth.
A few decisions worth explaining
Medians, not averages. Household spending is lumpy: one month has a car repair, the next has a refund. An average would make every normal month look cheap. "Typical" in the app always means the median of the previous twelve months, and one-off "project" spending (a house, a wedding) can be switched off with a single toggle.
No AI. The Gemini report was fun, but the useful parts of it were just arithmetic: what's above usual, which budgets are over, which expenses are unusual. Those are computed directly now. They're deterministic and free, and nothing leaves the server.
Bank balance without bank access. Connecting banks is harder than it sounds. Open-banking aggregators come and go, consent expires every 180 days, and investment accounts aren't covered at all. The app takes a simpler route:
- Now and then you tell it the real total (
balance 4520.30). - It adds and subtracts everything logged since.
- At the next check it shows the gap, which is a surprisingly honest measure of how much spending never gets logged.
A payment that never touched your accounts, like a family gift paid straight to the seller, can be marked as such so it doesn't skew the estimate.
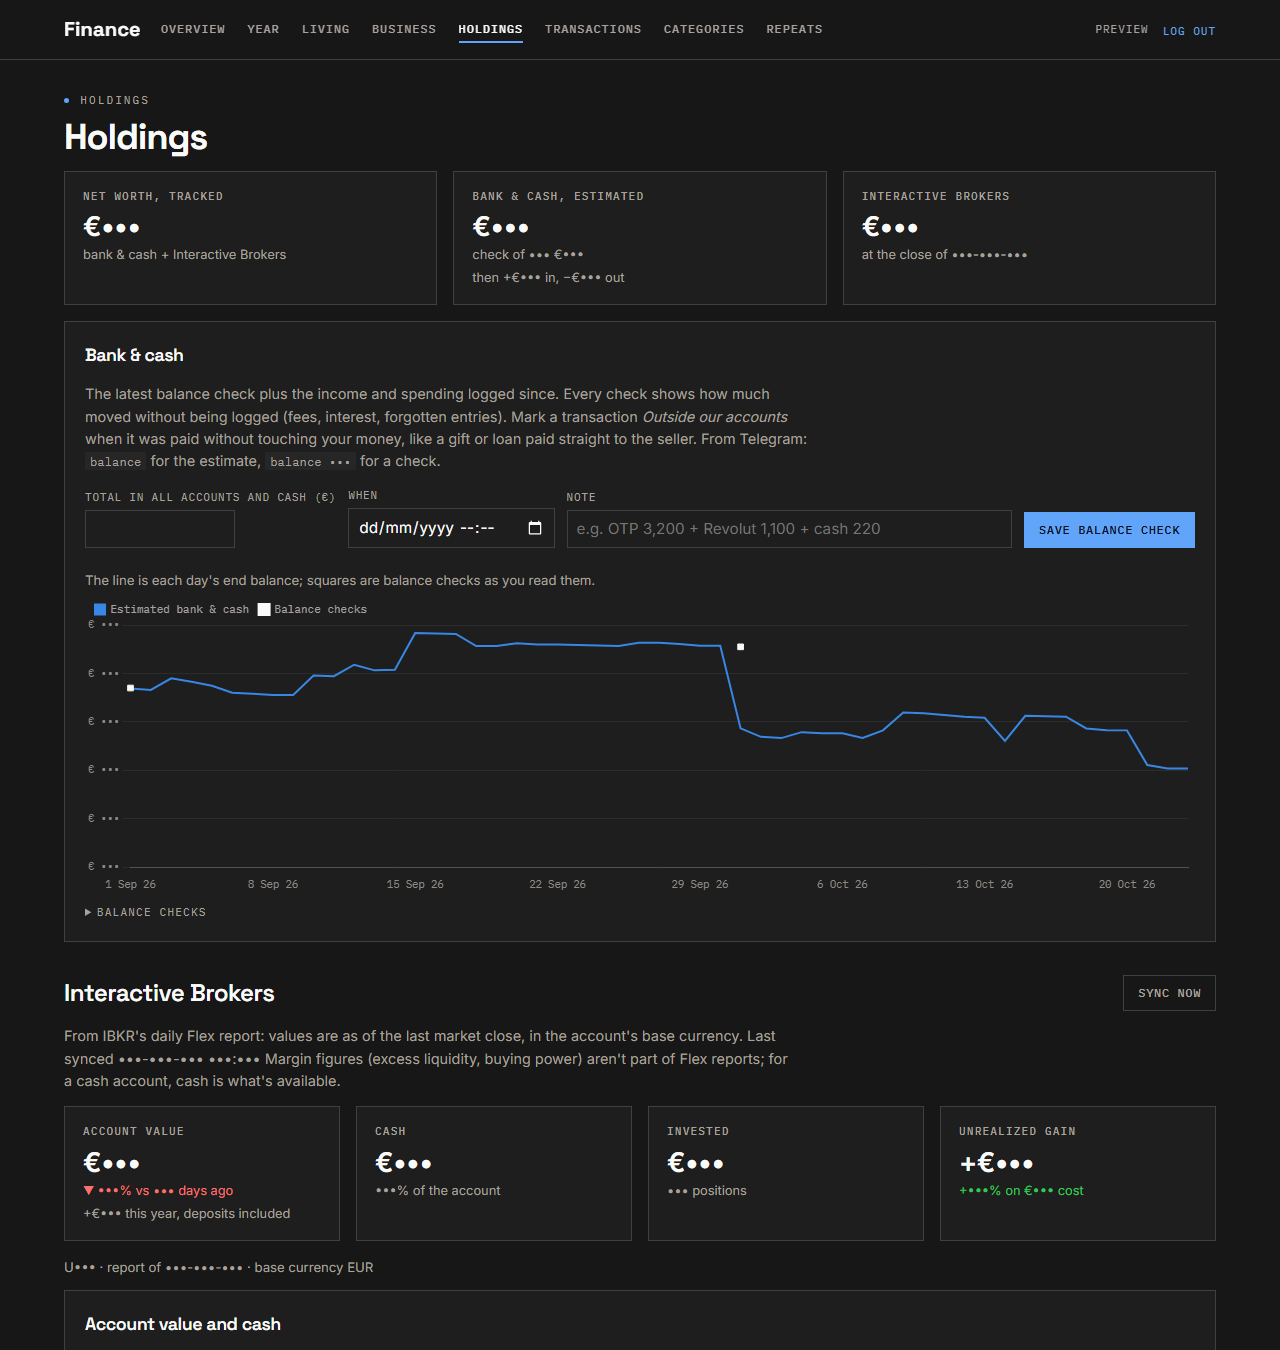
Investments through IBKR's Flex Web Service. Interactive Brokers offers read-only reports over a small HTTP API, so there's no gateway to keep logged in. Every morning the server fetches the previous day's account value, cash per currency and positions. The first sync loads a year of history. When the token expires, Telegram says so.
Privacy by default:
- Login: passwordless. A one-time code or link arrives by email, and only the addresses in the config can log in.
- No third parties: fonts and the chart library are served by the app itself, so opening the dashboard sends nothing to Google or a CDN.
- One file to back up: the whole database is one SQLite file, and it backs itself up daily.
One design language. The portal uses the same typefaces, stone colors and square corners as this blog: Inter, Space Grotesk and IBM Plex Mono. It's dark only. The charts use a color palette that I checked with a color-blindness validator, and every chart can be shown as a table.
Moving the data over
The import reads the old sheet as a CSV export, in whatever format the sheet's locale produced: US or European dates,
decimal commas, TRUE/FALSE in another language. It works out the date order from the data itself.
To check the import, I compared monthly totals with the sheet's own yearly tabs. They matched to the cent, apart from the month where the sheet's formula had missed two rows. Category clean-up, like merging spellings and putting trips under one category, happens during the import. Every entry keeps its original spelling, so any merge can be undone with one button.
Try it
The code is open source under the MIT license, free for personal and commercial use as long as the copyright notice stays in:
github.com/thestrudl/finance_v2
You need a server with Docker, a domain, a Telegram bot and an SMTP mailbox. The README walks through the rest.
Household-specific categories go into a private household.json that never ends up in git.